Pcons.net Protein Structure Prediction Meta Server
Thursday, March 26 2026
Main Menu
Submission
Queue
About Pcons
About Pmodeller
About Pcons.net
Database status
Download
©
Arne Elofsson
21910 : MADD_wt_755-775res
Your submitted sequence:
sequence (23 aa)
Ready methods:
PCONS
PMODELLER
blast
dppas
dppas2
env-ppas
ffas
hhpred2
muster
pgenthreader
ppas
rpsblast
wdppas
wmuster
wppas
Queued locally:
itasser
wmuster
Rank
Model
Method Score
Pcons
Pcomb
ProQ2
ProQ / ProQresSum
Template
CATH
Alignment
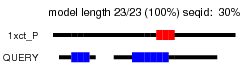
1
0.201
0.245
0.420
1xct_P
N/A
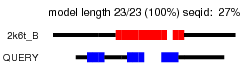
2
0.173
0.222
0.417
2k6t_B
N/A
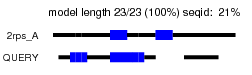
3
0.175
0.209
0.344
2rps_A
N/A
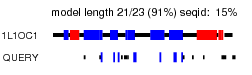
4
0.170
0.188
0.259
1L1OC1
2.40.50.140.26.1
2.40.50.140.33.1
2.40.50.140.53.1
2.20.25.10.5.1
2.40.50.140.26.1
2.40.50.140.33.1
2.40.50.140.53.1
2.20.25.10.5.1
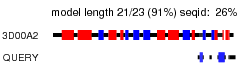
5
0.161
0.169
0.199
3D00A2
1.20.90.10.2.2
1.10.490.20.3.1
3.40.50.2020.6.2
3.40.50.1240.1.3
1.20.120.160.3.1
1.50.10.20.2.1
2.60.175.10.1.1
2.60.120.40.1.1
1.10.287.210.2.2
1.20.1260.10.2.2
3.20.20.70.7.1
3.30.1360.20.1.1
3.10.360.10.1.1
1.10.490.10.3.1
2.40.50.100.3.1
3.10.420.10.1.2
1.10.620.20.1.1
3.90.550.10.9.1
3.40.50.1950.3.1
1.10.1170.10.4.1
3.20.20.70.62.2
1.10.20.10.4.1
1.10.20.10.3.1
2.60.40.1200.1.1
1.10.490.10.11.1
3.30.1330.50.1.1
3.40.50.270.1.1
2.40.128.30.1.1
1.10.20.10.3.1
1.20.120.10.2.1
2.40.50.110.1.1
1.10.760.10.19.2
3.20.20.100.3.1
3.50.20.10.2.1
2.40.128.30.1.1
1.20.5.50.10.1
3.90.70.10.2.5
4.10.80.10.3.1
2.30.42.10.20.1
3.30.1330.40.2.4
3.90.550.10.2.1
1.20.225.10.1.1
2.60.120.180.3.2
3.40.50.300.60.1
1.25.40.20.6.2
3.40.50.720.103.1
3.40.50.300.118.2
1.10.565.10.3.4
3.40.800.10.1.1
3.30.559.10.1.2
2.60.120.200.31.1
3.40.50.2020.3.1
3.10.100.10.21.1
1.20.5.50.5.1
1.20.1260.10.8.2
3.40.50.960.4.1
3.20.20.70.58.1
3.40.50.300.10.1
3.40.600.10.2.1
3.20.20.70.28.1
1.10.490.10.11.2
3.60.21.10.7.1
3.30.70.120.1.3
1.25.10.10.6.1
3.20.20.70.55.1
3.10.129.10.7.1
3.10.270.10.1.1
3.10.20.90.1.1
3.40.50.1580.1.2
3.20.20.60.1.1
3.20.20.70.30.1
1.10.620.20.1.1
3.10.270.10.1.1
1.10.490.10.3.1
3.40.50.720.24.1
3.90.175.10.1.1
2.40.128.20.23.2
3.80.10.10.5.2
1.20.5.50.3.1
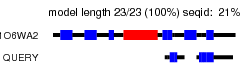
6
0.187
0.363
1.065
1O6WA2
2.20.70.10.5.1
2.20.70.10.3.1
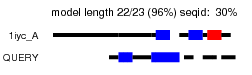
7
0.166
0.240
0.534
1iyc_A
N/A
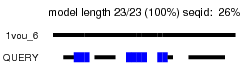
8
0.148
0.164
0.230
1vou_6
N/A
9
N/A
N/A
N/A
N/A
N/A
4gopC2
N/A
N/A
10
0.153
0.156
0.168
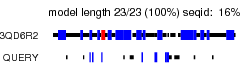
3QD6R2
N/A
References
© 2006 Stockholm University, Stockholm Bioinformatics Center